Disclaimer: The information provided here has been prepared with care for my own use. However, I give no guarantee as to its accuracy, and use by others is entirely at their own risk. Your use of this information implies acceptance of this disclaimer. Without lifting, there are two ways to get out to the sea from the Broads. You can go through Mutford Lock at Oulton Broad, traverse Lake Lothing, and out through one of the scheduled lifts of Lowestoft Bascule Bridge. Alternatively, you can cross Breydon water, go under or through Breydon lifting bridge, and then out through Haven Bridge. However, Haven Bridge has been unreliable throughout 2021. Under normal conditions, the low tide bridge height can vary quite a bit, so it's important for medium sized boat owners to be able to estimate the current height and predict when the best time will be to go under it. The excellent Project Troll website used to display the Haven Bridge height in real-time but went back to "Coming Soon" status late Oct 2021. I hope this will be restored at some time in the future. As useful as this was, it is desirable to be able to predict the height several days ahead, and I have added this functionality to my boatinginfo.co.uk site. This article describes the process and provides a couple of additional downloads that may be useful and reassuring for boats wanting to get under Haven Bridge.
So what's already in place? Peel Ports have a PDF guide but it assumes a 1:1 correspondence between the current tide and the bridge height. This is only likely to be accurate if you know the actual tide at Haven Bridge since the tidal range up river is less than that at the port opening at Gorleston. The BA tide tables use the Gorleston (Yarmouth Bar) datum and can be used directly with the Peelports equation (4.3m – tide). However, they do not take account of the reduced tidal range upriver which is typically about 87% at Haven Bridge. Nevertheless, this is a fairly easy method and the overprediction at low tide is of the same order of magnitude as the difference between the bridge apex and an imaginary line drawn between the two bridge passing arrows. It can look daunting though as you approach:- 
There are tide boards on both sides of the bridge but they are pretty useless for checking your clearance because they are badly fouled below the waterline. Nevertheless, we can obtain some useful information from them at high and low tide. We can compare the value at a high tide with the environment agency flood data API to see how the range varies at Haven Bridge compared to the flood gauge data at Gorleston and Lowestoft (more on this later). 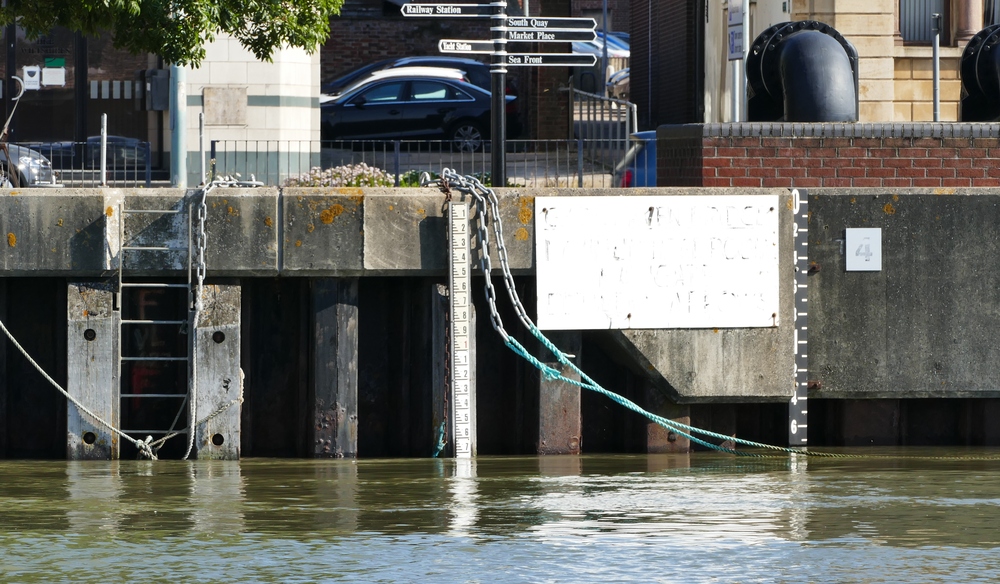
Then we can use measuring tools (I used PDF-XChange Viewer in a PDF version) to align with known distance to create new measurements where the tide gauge is obscured: 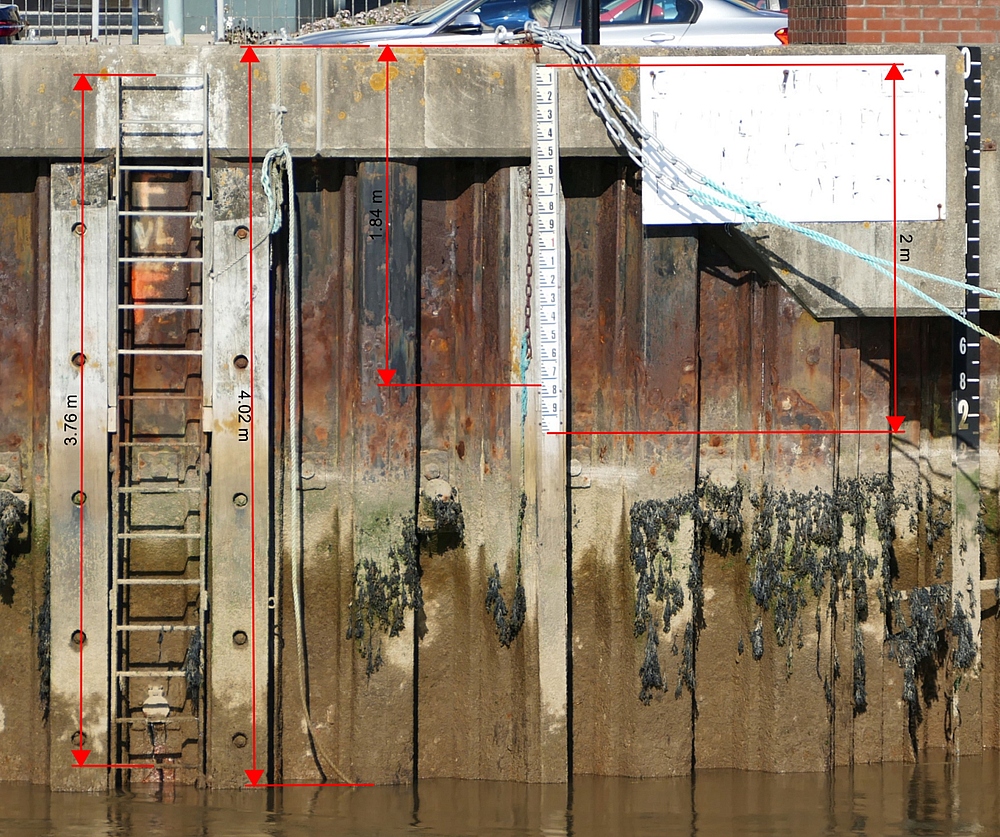
This provides an accurate measurement of the water level below the top of the flood wall. Next, we need to estimate the height of the bridge above this flood wall. The flood walls are the same height, so by placing the camera on the flood wall some distance away, it’s possible to create a line under the bridge apex: 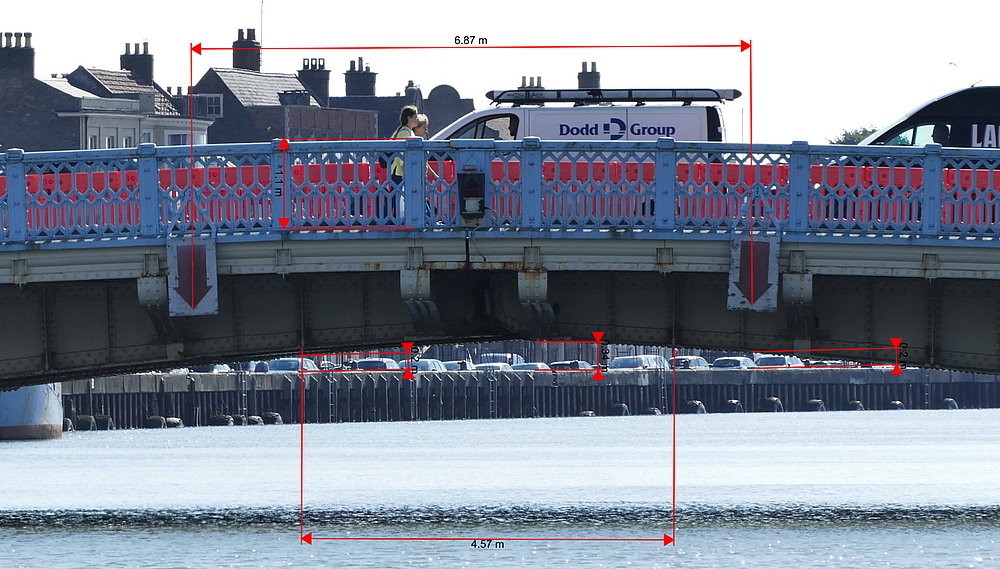
By using a known length – in this case the height of the bridge railing posts, it’s possible to make fairly accurate assessments of the apex height and clearance. This was repeated in a couple of directions. There is a small safety margin because the centre of the camera lens is almost 2” above the wall surface and any off-axis alignment (as seen here) tends to reduce the apparent height.
Another check is to look at the height of the water on the bridge columns: Using photographs of these at high and low tides, it can be seen that the brick heights and architecture features provide useful reference points. Low Tide: 
High Tide 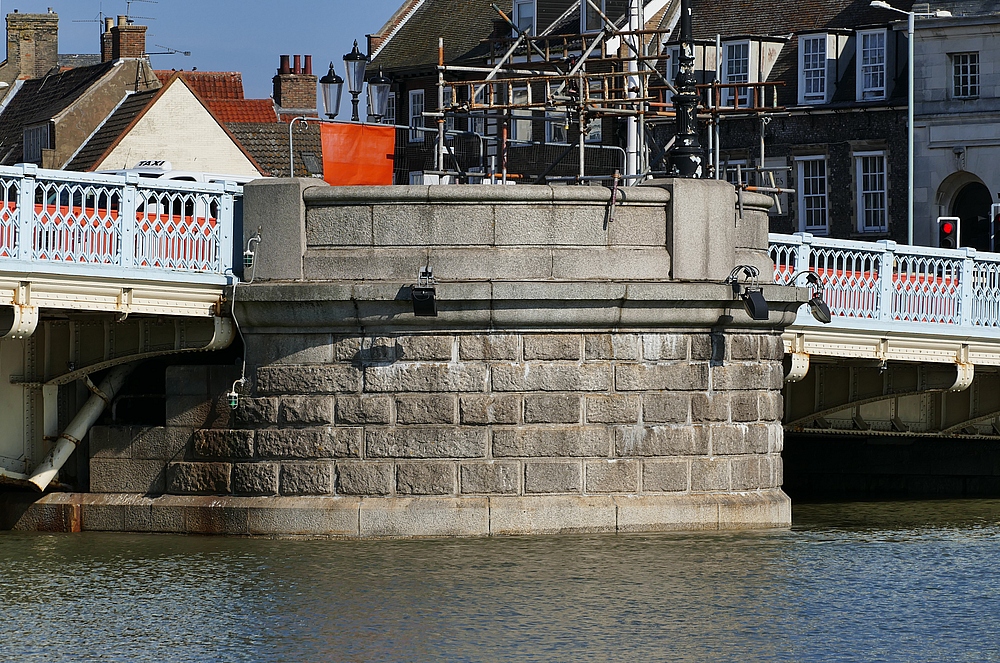
Using the tidal range from the previous tide gauge measurements (2.18m), it’s then possible to create an image showing the bridge heights against the water levels on the columns: .jpg)
This confirmed the previous estimations of the apex height compared to the flood wall height, ie. 30cm higher. Although this method can be used for both directions, the tide gauge on the south side has a useful nearby ladder that can also be used to estimate the bridge height: .jpg)
If you can read the height board, just add 0.3m to get the bridge height. These two images may be useful, so you can download a high quality PDF version (and use at your own risk).
Boatinginfo.co.uk makes use of two web APIs for estimating bridge heights: The Environment Agency data is interesting because of the sheer number of stations including many of the Broads rivers. Unfortunately, not all the stations provide real-time data, and some of those that do are not as reliable as others. There is actually such a station for Haven Bridge (seems to mainly be updated once a day, early in the morning) and analysis of readings against Lowestoft and Great Yarmouth showed that there was a better correlation with Lowestoft real-time data (partly because Lowestoft tides are later than Gorleston): 
You can see that there is a very obvious hysteresis effect due to the slight difference in tide timings (worse in the case of the Gorleston tide gauge). However, by using a bit of Excel calculation, it's not too difficult to extract the actual peaks and troughs from the Haven Bridge Tide Gauge (typically only updated once a day, unfortunately) and then find the corresponding ones in the Lowestoft tide gauge data. When you do this, you get a much better correlation representing the same features, even when they occur up to 45 minutes apart:- 
Using the daily height board readings captured by the helpful guys at the Great Yarmouth Yacht Station, I was able to correlate these readings to come up with a best estimate for Vauxhall Bridge. I already have fairly good data for Haven Bridge using its tide gauge, and the heights are inversely related to the tide gauge height, so I have just calibrated those against my set points described at the top of this article. 
This correlation forms the basis of estimating the current Haven Bridge height at its entry on boatinginfo.co.uk [Update 27 May 2024 - over the past year, the Haven Bridge tide gauge has been updating at 15 minute intervals. Therefore the above link will now use the Haven Bridge tide gauge when available - increasing the accuracy. It will only use the Lowestoft tide gauge if the Haven Bridge one becomes unavailable.] The tide predictions are based on the Admiralty API using the Gorleston station (0142). These are marginally more accurate for predicting the height than the Lowestoft one (0141), but are about 50 minutes earlier than the lowest tide at the bridge. I have calibrated my bridge height predictions for the Low & High tides against this API based on the same data used for the near-live estimates. It should be noted that whilst the near-live bridge height estimates are pretty good, the tide predictions only have an 88% confidence figure. Typically these tide predictions will be within about 0.2m either way depending on wind direction and atmospheric pressure. However, in extreme conditions - such as spring tides - this error can be very high. As I update the site, I will add more detail here. If you're interested in seeing some of the R&D captures, I have created a tides subdomain of the boatinginfo.co.uk site. You can also look at the last 7 days bridge height estimates on this graph. Updated 27 May 2024 - change reflecting higher availability of Haven Bridge tide gauge,
Updated 21 November 2021 - reflecting Project Troll is no longer including Haven Bridge and updated graphic scaling to 100% width so that it's easier to read on mobiles.
Updated 6th November 2021
Original article 24th September 2021 |  Kevin Millican